 CLOSE SIDEBAR
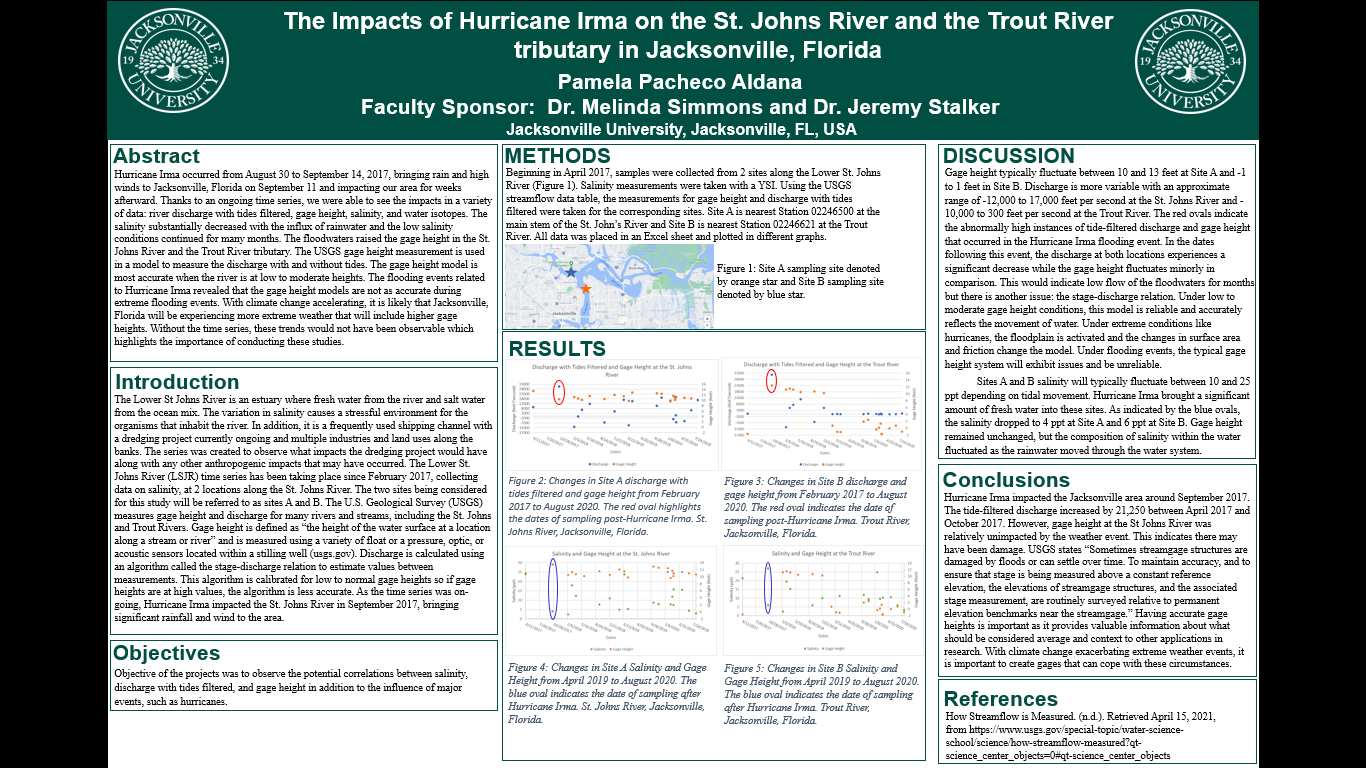
The Impacts of Hurricane Irma on the St. Johns River and the Trout River Tributary
Pamela Pacheco Aldana
Hurricane Irma occurred from August 30 to September 14, 2017, bringing rain and high winds to Jacksonville, Florida on September 11 and impacting our area for weeks afterward. Thanks to an ongoing time series, we were able to see the impacts in a variety of data: river discharge with tides filtered, gage height, salinity, and water isotopes. The salinity substantially decreased with the influx of rainwater and the low salinity conditions continued for many months. The floodwaters raised the gage height in the St. Johns River and the Trout River tributary. The USGS gage height measurement is used in a model to measure the discharge with and without tides. The gage height model is most accurate when the river is at low to moderate heights. The flooding events related to Hurricane Irma revealed that the gage height models are not as accurate during extreme flooding events. With climate change accelerating, it is likely that Jacksonville, Florida will be experiencing more extreme weather that will include higher gage heights. Without the time series, these trends would not have been observable which highlights the importance of conducting these studies.
Powered by Acadiate
© 2011-2024, Acadiate Inc. or its affiliates · Privacy