
Putting the 2020 California Wildfire Season into Context Within New 1991-2020 Climate Normals
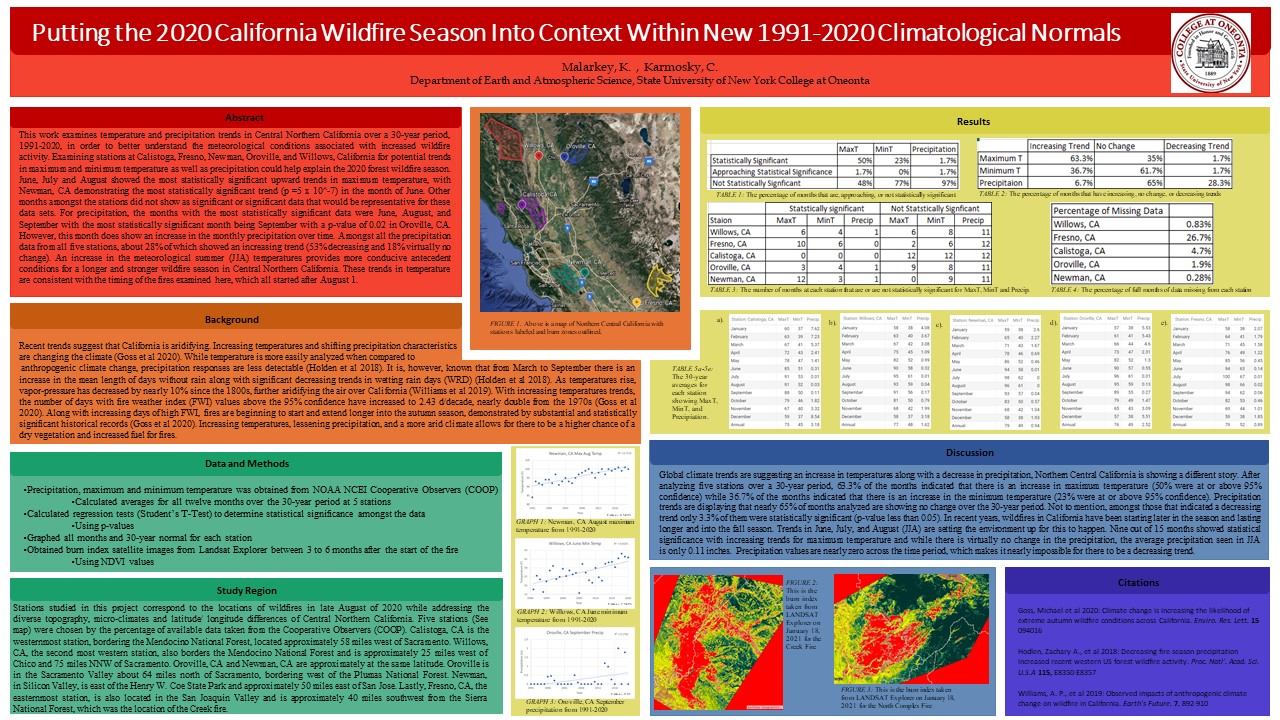
This work examines temperature and precipitation trends in Central Northern California over a 30-year period, 1991-2020, in order to better understand the meteorological conditions associated with increased wildfire activity. Examining stations at Calistoga, Fresno, Newman, Oroville, and Willows, California for potential trends in maximum and minimum temperature as well as precipitation could help explain the 2020 forest wildfire season. June, July and August showed the most statistically significant upward trends in maximum temperature, with Newman, CA demonstrating the most statistically significant trend (p =5 x 10^-7) in the month of June. Other months amongst the stations did not show as significant or significant data that would be representative for these data sets. For precipitation, the months with the most statistically significant data were June, August, and September with the most statistically significant month being September with a p-value of 0.02 in Oroville, CA. However, this month does show an increase in the monthly precipitation over time. Amongst all the precipitation data from all five stations, about 28% of which showed an increasing trend (53% decreasing and 18% virtually no change). An increase in the meteorological summer (JJA) temperatures provides more conducive antecedent conditions for a longer and stronger wildfire season in Central Northern California. These trends in temperature are consistent with the timing of the fires examined here, which all started after August 1.