 CLOSE SIDEBAR
VEGF Levels in RVO
Jonathan Axford
Poster Title: VEGF Levels in RVO
Student: Jonathan Axford, Class of 2024
Faculty Mentor and Department: Mark Nelson, MD, Ophthalmology and Rebecca Sappington, PhD, Neurobiology and Anatomy
Funding Source: The Harry O. Parker Neuroscience Research Fund
ABSTRACT
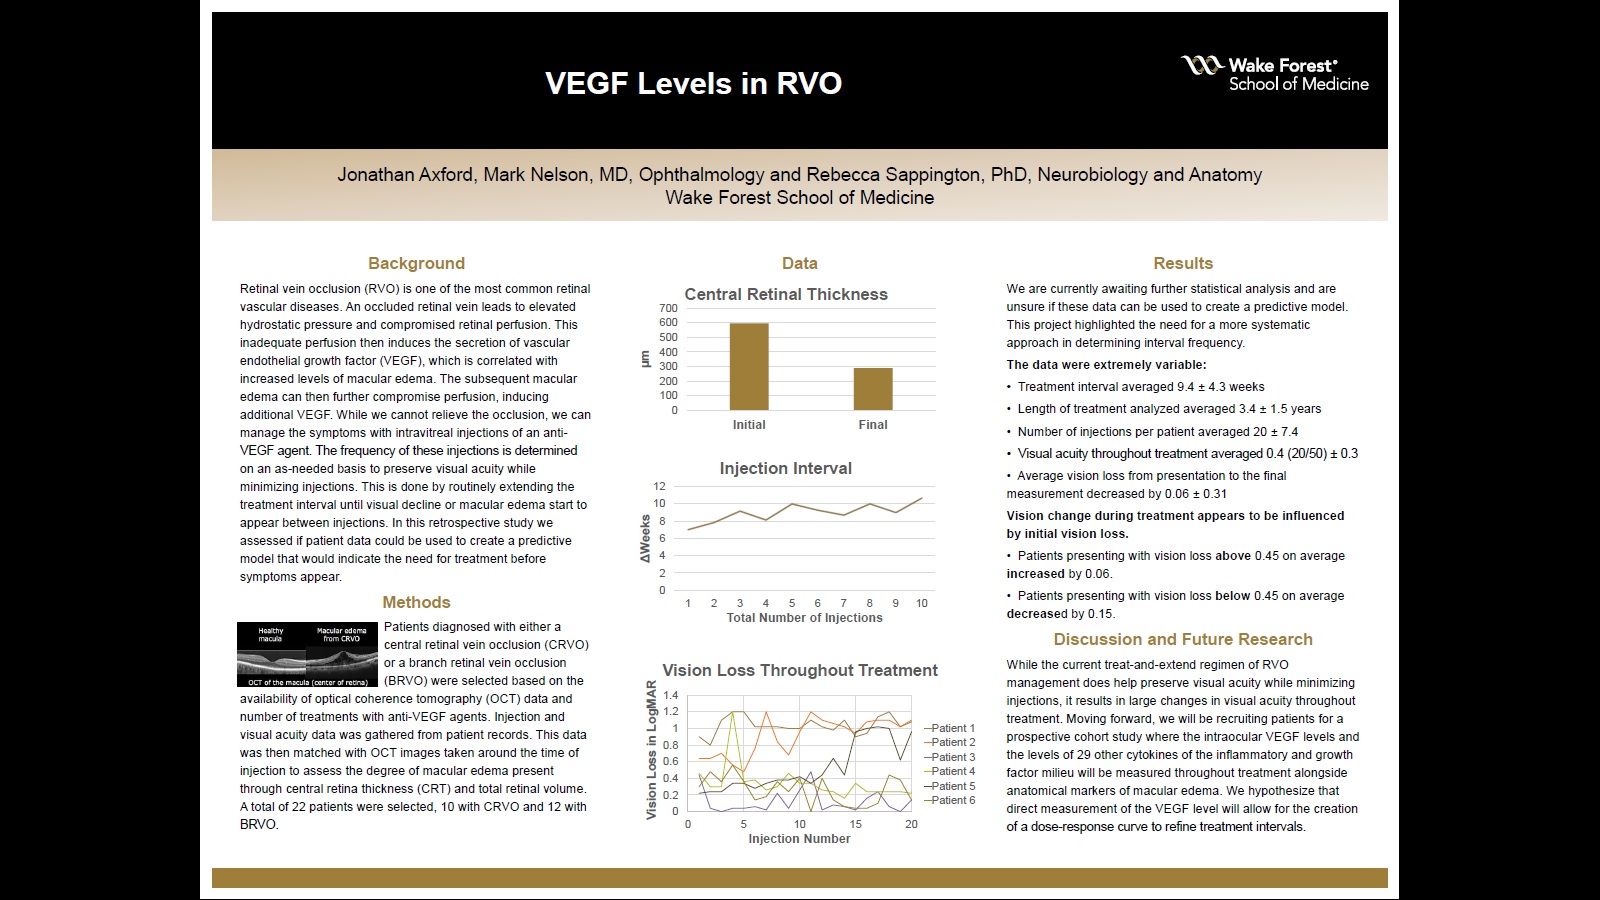
Background: Retinal vein occlusion (RVO) is one of the most common retinal vascular diseases. An occluded retinal vein leads to elevated hydrostatic pressure and compromised retinal perfusion. This inadequate perfusion then induces the secretion of vascular endothelial growth factor (VEGF), which has been linked to several vision-threatening conditions, such as macular edema and neovascular glaucoma. Attempts to remove the occlusion have often done more harm than good. For this reason, once a patient is diagnosed with an RVO they will require continuous monitoring to determine if an intravitreal injection with an anti-VEGF is warranted to preserve vision. The frequency of these monitoring visits and thus the injections are determined on an as-needed basis and is highly variable. The current standard of care aims to minimize unnecessary treatments while preserving visual acuity through a treat-and-extend model. This is done by routinely extending the treatment interval until visual decline or macular edema appear between injections. This retroactive approach often results in visual decline before treatment is warranted or multiple follow up visits indicating that treatment isn’t warranted. This study aims to assess if patient data can be used to create a model that could provide some predictive value as to when the next injection should be administered.
Hypothesis: The total number of injections correlates with the average interval, central retinal thickness, retinal volume, and visual acuity. Additionally, these data could be used to create a model that helps determine future interval frequency.
Methods: This was a chart review where the injection data, macular volume, visual acuity, and central retinal thickness were gathered from patient records. Central retinal thickness and retinal volume were determined using prior optical coherence tomography images.
Results: Thus far, we have not been able to create a model with these data but are pending further analysis. The data showed a great deal of both intra- and inter-patient variability. The average interval throughout treatment was 9.4 ± 4.3 weeks. Visual acuity throughout treatment averaged 20/50. The average difference in presenting CRT to the final measurement was 308 ± 197μm.
Conclusions: Our aim is to determine if a predictive model can be obtained with these data. The large observed variability makes the treat-and-extend regimen challenging. This highlights the need for a more systematic approach coupled with additional data for the management of RVO with anti-VEGF agents.
Source of mentor’s funding or other support that funded this research: This project was supported by pilot research funds from the Department of Ophthalmology (PI: Mark Nelson, MD), Wake Forest School of Medicine.
Powered by Acadiate
© 2011-2024, Acadiate Inc. or its affiliates · Privacy